How to Analyze a Stock: A 6-Step Practical Guide
Learn how to analyze a stock using our practical 6-step guide. Cover fundamental and technical analysis, valuation, and risk management to invest smarter.

Those who want to learn how to analyze a stock start in the wrong place. They open a chart, read a few headlines, glance at a valuation ratio, and still have no idea whether the business deserves their money.
The problem usually isn't effort. It's workflow. There are too many stocks, too much commentary, and too many checklists written as if you have an entire weekend for every ticker.
A workable process is narrower. You need a funnel that helps you reject mediocre ideas quickly, spend real time only on the survivors, and make a decision before information overload turns into paralysis.
Don't Just Pick Stocks Build an Analysis System
If your current routine looks like bouncing between news feeds, brokerage tabs, and random social posts, you're dealing with noise, not analysis. A stock analysis system fixes that by putting each idea through the same sequence of filters.
That matters because time is limited for almost everyone. A discussion among value investors described a workflow many professionals use: they narrow candidates with screening in 2-3 minutes, do a 30-45-minute skim of the 10-K focused on margins and ROIC, and save a 4-5 hour deep dive for stocks that still look clean. The same discussion notes that a 2025 CFA Institute survey found 68% of individual investors spend less than 30 minutes weekly on research (Reddit discussion of time-graded stock research).
Practical rule: Don't give every stock equal attention. Most ideas deserve a quick rejection, not a weekend of work.
The mistake many retail investors make is treating all analysis as deep analysis. That creates two bad outcomes. Either you research almost nothing because the bar feels too high, or you spend hours on weak companies that should have been filtered out in the first few minutes.
A better system has tiers:
- Screen fast to build a small watchlist.
- Check the financial statements for basic business health.
- Estimate fair value so you know whether the stock is merely good or priced well.
- Review qualitative and technical context to avoid buying a solid business at a bad time or for the wrong reason.
- Write a thesis and risk plan before you buy.
What a repeatable process changes
A repeatable system does three things that scattered research can't do.
- It reduces emotional decisions. If every stock gets the same first-pass treatment, hype has less influence.
- It improves comparison. Two companies are easier to compare when you've checked the same few items on each.
- It protects your time. You stop reading every line of every filing before the stock has earned that effort.
Good stock analysis isn't about knowing everything. It's about knowing enough, in the right order, to decide whether more work is justified.
That's the mindset seasoned investors use. They don't confuse activity with conviction. They build a process that makes the next decision obvious.
Finding Promising Stocks with Smart Screening
A screen is the top of your funnel. Its job isn't to pick winners for you. Its job is to cut thousands of stocks down to a shortlist that's worth reading about.
That distinction matters. If you expect a screener to hand you perfect buys, you'll keep tweaking filters until you create a list that only looks precise. If you use it properly, you'll get something more useful: a manageable pile of candidates that fit your style.
Start with broad filters, not clever ones
The first pass should answer one question: which businesses deserve a closer look? That usually means filtering for simple attributes you can defend.
A practical starter screen might include:
- Market capitalization: Use this to avoid businesses outside your comfort zone. Smaller companies can offer more upside, but they often come with thinner coverage and wider swings.
- Sector or industry: If you don't understand banks, biotech, or commodity businesses, don't force them into your list just because a ratio looks cheap.
- Basic valuation multiples: P/E is the common starting point because it's easy to interpret and compare.
- Profitability or cash generation signs: You want businesses that show evidence of a workable model, not just a good narrative.
- Watchlist relevance: Some investors only screen for new ideas. Others also use screens to revisit stocks they've followed before.
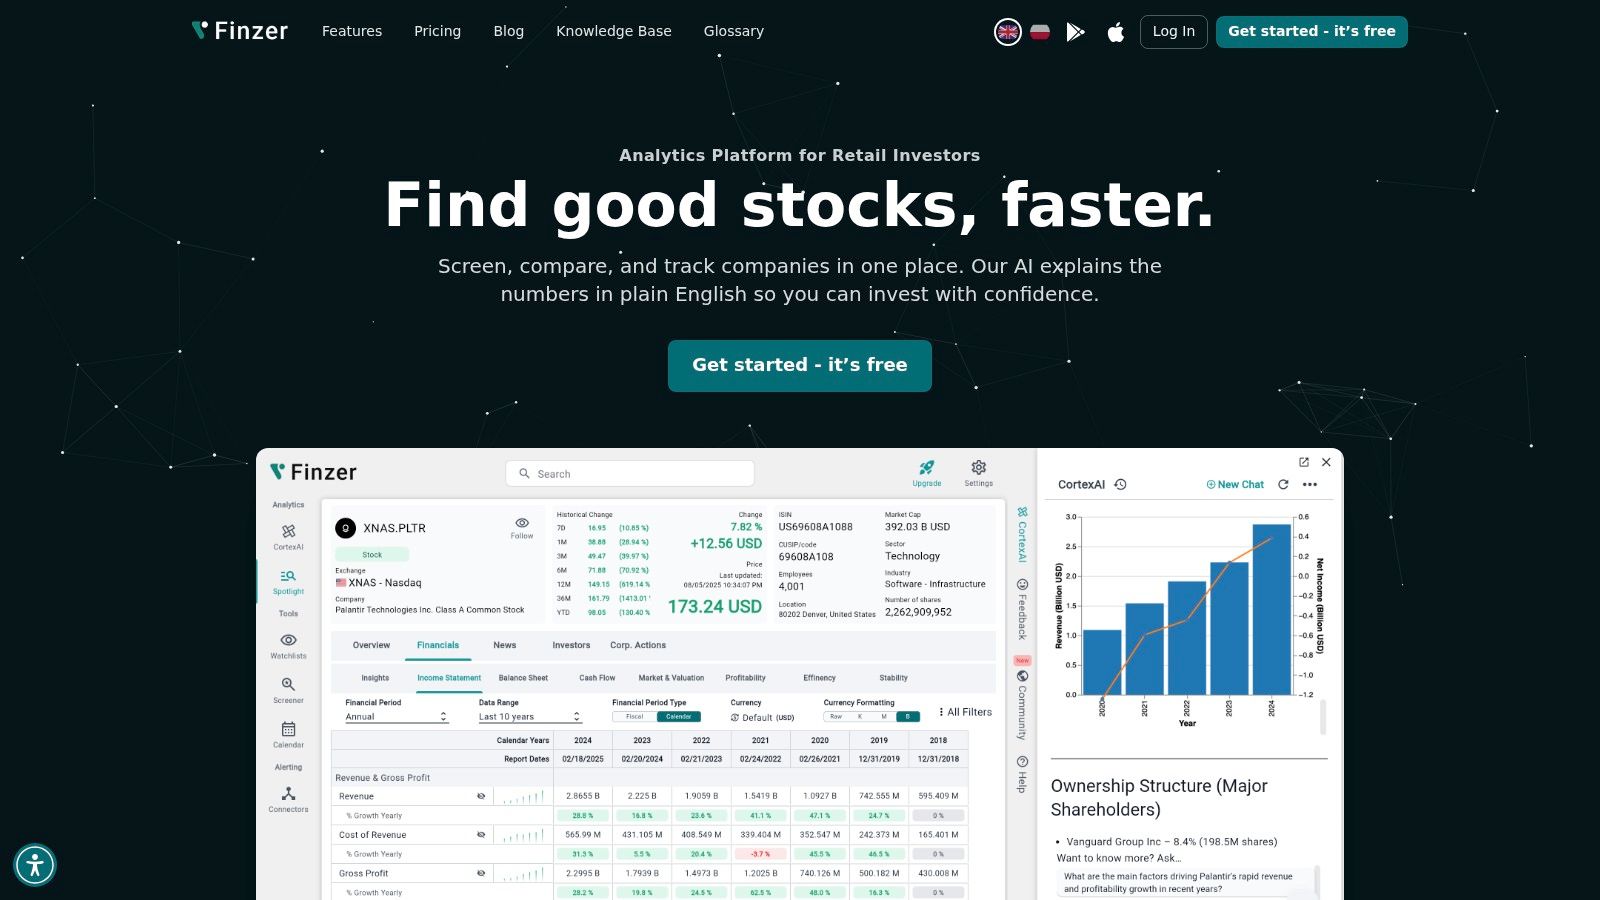
Tools provide significant assistance. A platform like Finzer lets you sort and filter listed companies quickly by common metrics and narrow a broad market into a small working list.
Build screens around your style
Most weak screens fail because they're borrowed from someone else. A deep value investor, a quality investor, and a trend-following trader shouldn't run the same filter stack.
Here are three examples of how to approach this:
- Value-first: Start with modest valuation multiples, then check whether the business is still profitable and financially stable.
- Quality-first: Begin with durable margins, balance-sheet strength, and steady operating performance, then look at price.
- Idea-generation only: Keep filters loose. The point is variety, not precision, because actual judgment will happen later.
A screener should produce names you can explain in one sentence. If you can't say why a company appeared on your list, your filter set is too messy.
For a practical walkthrough of setting filters and narrowing a universe step by step, this guide on how to screen stocks is worth bookmarking.
What works and what usually doesn't
Screening works when it removes obvious mismatches. It doesn't work when investors try to compress the entire investment decision into a handful of numeric filters.
What usually works:
- Simple filters you can repeat
- Industry-aware comparisons
- A shortlist small enough to review manually
What usually doesn't:
- Overfitted screens that combine too many conditions
- Blind faith in low multiples
- Using one metric across every sector
A good screen gives you candidates. It doesn't give you conviction.
Once you have that shortlist, the critical work starts. Now you're no longer asking, "Which stocks match my filter?" You're asking, "Is this business healthy?"
Decoding Financial Statements for Core Insights
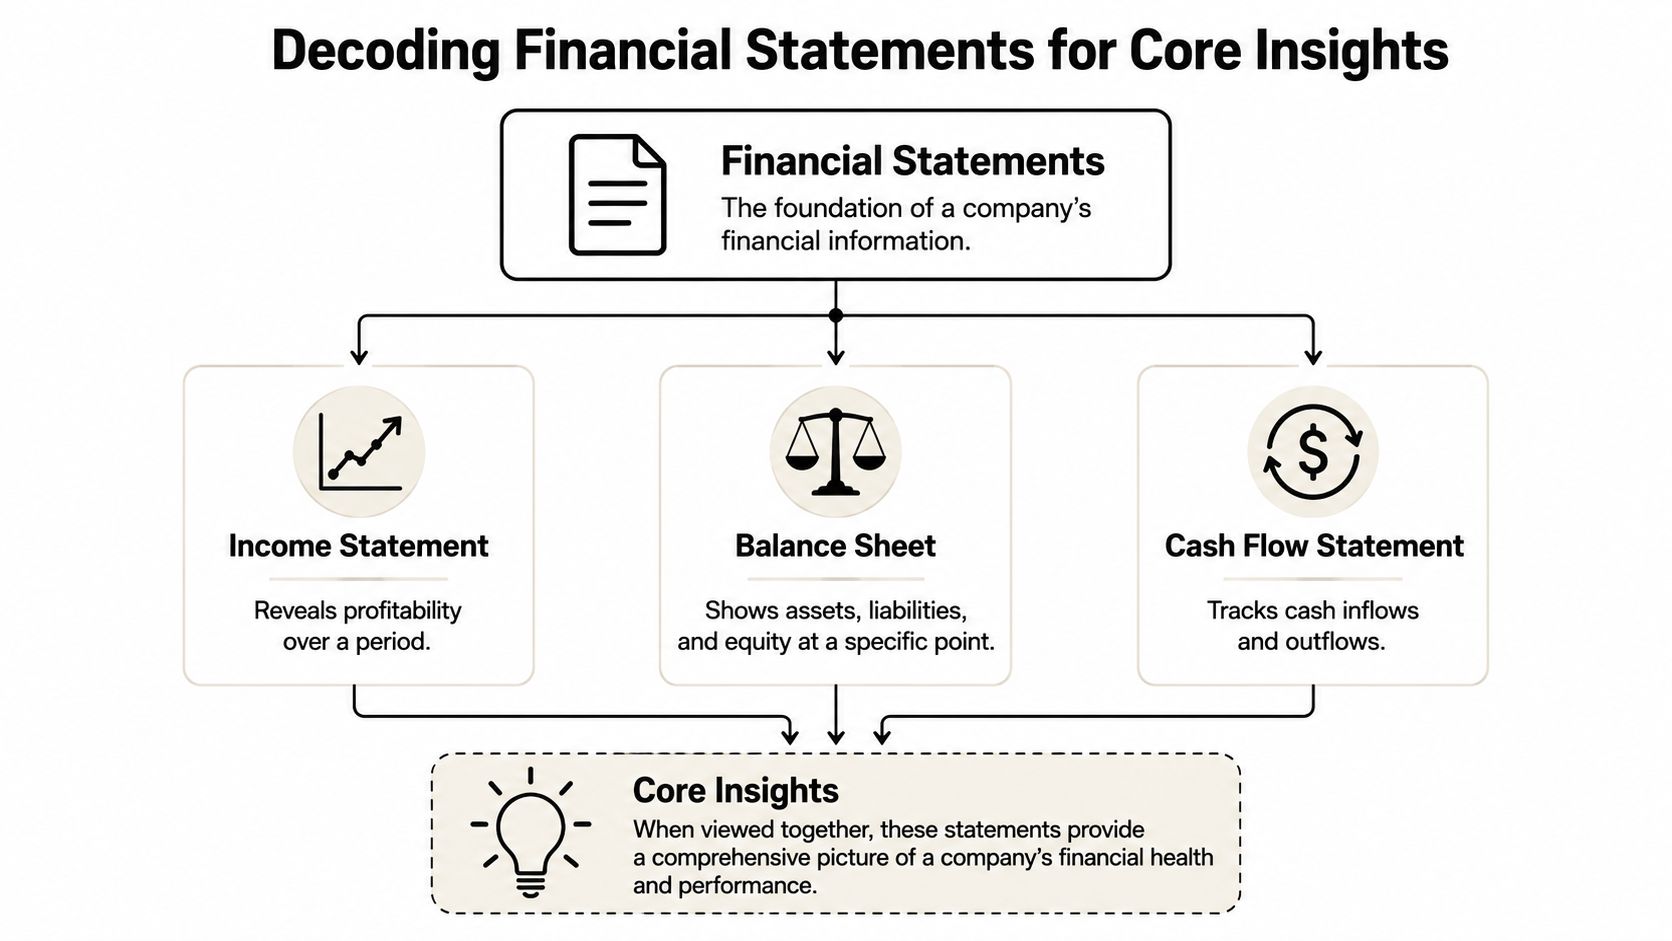
Once a stock survives screening, the next step is a fast fundamental review. The point isn't to become an accountant. It's to read the business through the three statements and decide whether the company deserves more of your time.
The standard process in fundamental analysis starts with screening, then reviewing the annual and quarterly reports to understand the company, and then calculating ratios tied to growth, profitability, solvency, and liquidity. One common mistake is leaning too hard on old numbers without understanding the company's current strategy (fundamental analysis process and pitfalls).
A quick visual helps keep the structure straight.
Read the income statement like an operating report
The income statement shows whether the company can turn sales into profit over a period of time. Most investors look at revenue first, but revenue alone doesn't tell you whether growth is useful.
A fast review should focus on a few questions:
- Is revenue moving in the right direction? You want to know whether the company is expanding, stalling, or shrinking.
- Are margins holding up? A business that grows sales while profitability deteriorates can be buying growth at a poor price.
- Are earnings understandable? If profit swings wildly from one period to the next, dig into why.
Don't read every expense line on the first pass. Read enough to understand the business model. A software company, a retailer, and a manufacturer will tell very different margin stories.
Use the balance sheet to judge staying power
The balance sheet is where you check what the company owns, what it owes, and how exposed it is if conditions worsen. This is the statement that often tells you whether a stock is cheap for a good reason or a bad one.
Look for these signals:
- Debt load: Debt isn't automatically negative, but it changes the risk profile fast.
- Liquidity: A company needs enough resources to handle normal operations without constant financial strain.
- Equity base: This helps you judge whether the firm is built on a solid foundation or propped up by obligations.
A strong business can survive a rough year. A fragile balance sheet can turn a rough year into a permanent problem.
If the balance sheet is weak, the rest of the story has to be exceptional. Most of the time, it isn't.
Trust cash flow more than polished earnings
The cash flow statement is where many weak ideas fall apart. Earnings can look respectable while actual cash generation stays thin. That's why this statement often acts as the final reality check.
In a rapid review, focus on:
- Operating cash flow: Is the core business bringing in cash?
- Capital intensity: Does the company need constant heavy spending just to stand still?
- Cash conversion: Are profits showing up in cash, or are they mostly accounting entries?
When profit and cash flow tell different stories, pause. Sometimes there's a harmless reason. Sometimes it's the start of a larger issue.
For investors who want a structured way to read all three statements together, this guide to analyzing financial statements lays out the connections clearly.
A workable 30-minute review
You don't need a heroic checklist. A fast statement review can be organized like this:
| Focus area | What you're looking for |
|---|---|
| Income statement | Sales direction, margin stability, earnings quality |
| Balance sheet | Debt burden, liquidity, resilience |
| Cash flow statement | Real cash generation, spending needs, cash conversion |
Then add one final check that many people skip. Read management's current explanation of the business. Numbers tell you what happened. Management's strategy tells you what they're trying to make happen next. You don't have to believe every word, but you do need to know what game they're playing.
That combination is enough for a first judgment. If the business looks understandable, financially sound, and internally consistent, then it has earned a valuation review.
Determining a Stock's Fair Value
A strong business can still be a poor investment if the stock price already assumes too much. That's where valuation comes in. You're no longer asking whether the company is decent. You're asking what price makes sense.
There are two broad approaches most investors rely on: relative valuation and absolute valuation. Both are useful. Both can mislead you when used badly.
Relative valuation is quicker and more grounded in the market
Relative valuation compares a company with similar businesses or with its own history. The classic starting point is the P/E ratio, which compares share price with earnings per share. A P/E of 20 means investors pay $20 for $1 of earnings, and comparing that figure to industry peers and the S&P 500's historical average of 15 to 20 can help you judge whether a stock looks potentially cheap or expensive (P/E ratio basics and context).
This method is popular because it's fast and intuitive. If one company trades at a much lower multiple than peers, the stock may be mispriced. Or the market may be warning you about weaker growth, lower quality, or higher risk.
Relative valuation works best when:
- the business has clear peers
- earnings are reasonably stable
- the industry isn't going through a major structural shift
It works poorly when:
- the company is cyclical and current earnings are distorted
- the peer group isn't sufficiently comparable
- the whole sector is overpriced or depressed
Absolute valuation forces you to think like an owner
Absolute valuation usually means a discounted cash flow model, or DCF. Instead of comparing the stock with peers, you estimate the present value of the cash the business can generate in the future.
That sounds more precise than it is. A DCF is only as good as the assumptions you put into it. If your revenue, margin, or capital spending assumptions are unrealistic, the output will look polished and still be wrong.
That's why I treat DCF as a thinking tool first and a precision tool second. It forces discipline. You have to decide what kind of business this is, how it grows, and what cash generation might look like under reasonable conditions.
If you want a hands-on explanation of the mechanics, this overview of the discounted cash flow model is a useful technical reference. For the forecasting side of the job, 2026 guide to forecasting from PlotStudio AI is helpful because valuation quality often depends less on the formula and more on whether your assumptions are coherent.
Valuation methods compared
| Attribute | Relative Valuation (Comparables) | Absolute Valuation (DCF) |
|---|---|---|
| Main logic | Compares the stock with peers or historical multiples | Estimates intrinsic value from future cash flows |
| Speed | Faster | Slower |
| Inputs | Market multiples and peer context | Forecasts for business performance and cash generation |
| Best use case | Mature companies with comparable peers | Businesses where long-term cash generation is the key question |
| Main strength | Easy to apply and easy to explain | Anchors valuation in business economics |
| Main weakness | Can inherit market mispricing from the peer group | Highly sensitive to assumptions |
What works in practice
Investors often get stuck choosing one camp. That's unnecessary. The better approach is to use both methods for different purposes.
- Use comparables to see how the market currently prices the business.
- Use DCF to test whether that market price makes sense under your assumptions.
- Use a valuation range, not a single magical target.
The goal of valuation isn't to find the exact price. It's to decide whether the current price gives you enough room for error.
That last part matters most. Every estimate contains uncertainty. If a stock only looks attractive under optimistic assumptions, the valuation hasn't helped you. It's just given you a spreadsheet-shaped excuse to buy what you already wanted.
Looking Beyond the Numbers for a Complete Picture
Some stocks look excellent on paper and still disappoint for years. Usually the missing piece is outside the spreadsheet. Numbers tell you what the business has done. They don't fully explain why it has done it, whether the edge is durable, or how the market is treating the stock right now.
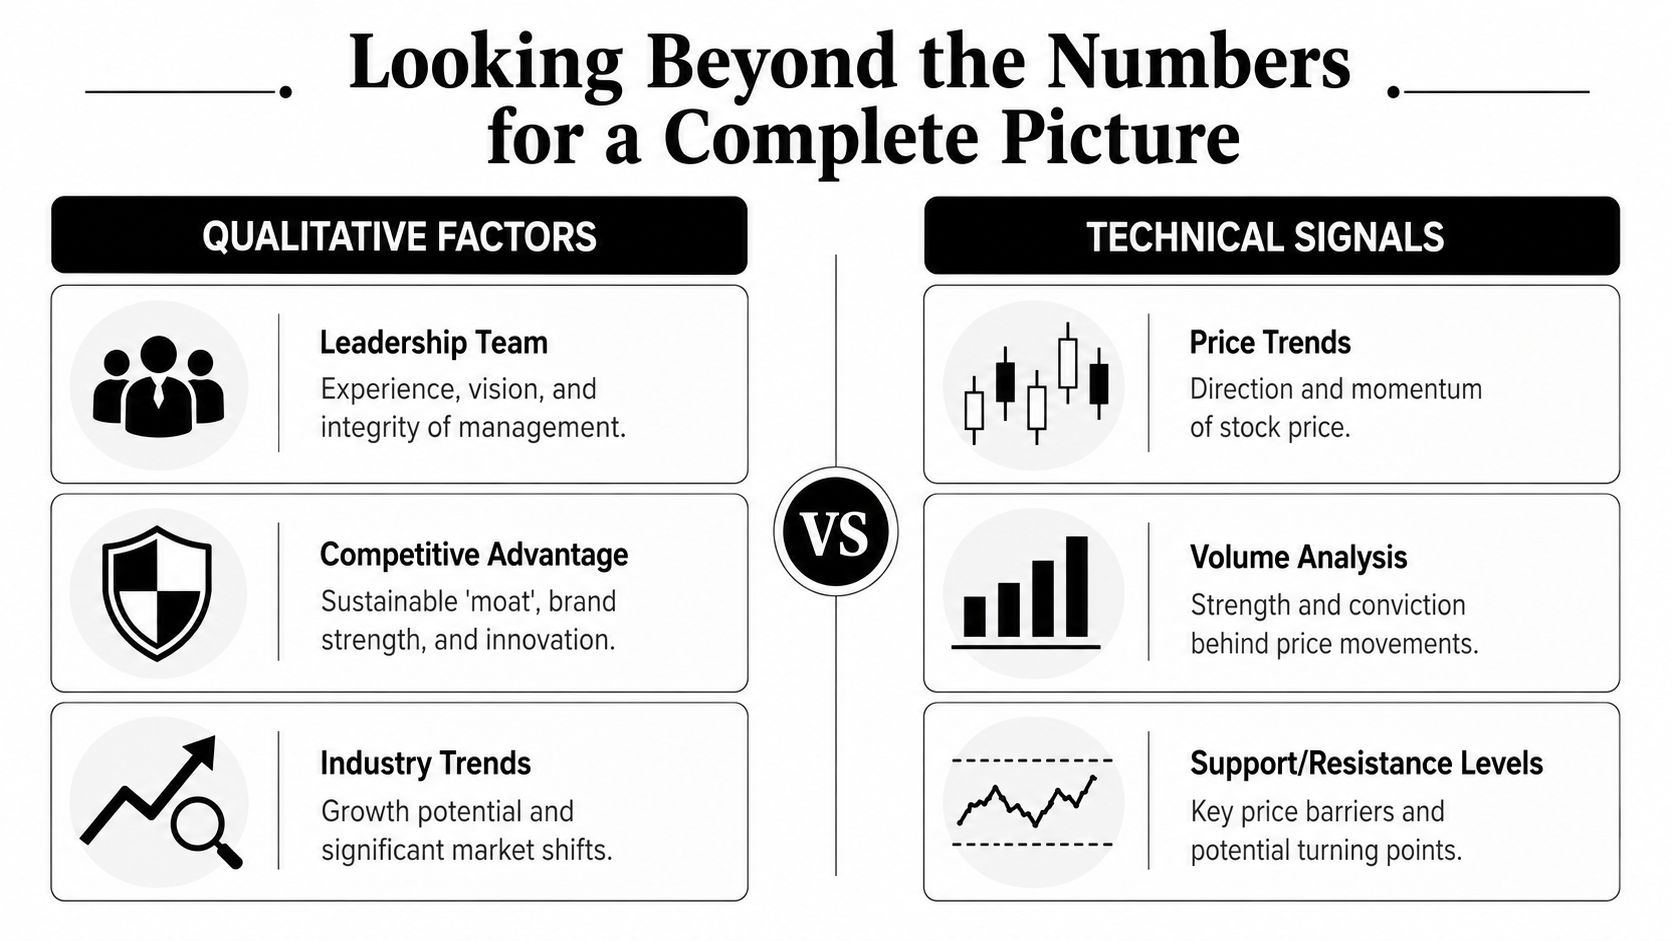
That's why a complete review combines qualitative judgment with a basic read of technical signals.
Qualitative factors explain business durability
Start with the business itself. You want to know why customers choose it, why competitors can't easily copy it, and whether management allocates capital sensibly.
A few prompts help:
- Competitive advantage: Does the company have brand strength, cost advantages, switching costs, network effects, or some other moat?
- Management quality: Are leaders candid, disciplined, and focused on returns, not just expansion for its own sake?
- Industry direction: Is the company operating in a field with supportive long-term demand, or one facing pressure from regulation, disruption, or oversupply?
This is also where you look for mismatch. A stock can be statistically cheap because the business is slowly weakening. That won't always show up clearly in one year's ratios.
Technical analysis is context, not prophecy
Technical analysis is useful when you treat it as a market-behavior tool, not a crystal ball. The basic method starts by identifying the overall trend as up, down, or sideways using trendlines or moving averages. The broader approach moves from the overall market to sectors and then individual stocks, using tools such as MACD and Relative Strength to gauge momentum and buying or selling pressure (technical analysis overview).
That gives you a practical framework:
- Check the broad market first. A weak market can drag down good stocks.
- Look at the sector next. Strong businesses inside weak groups often stay stuck longer than investors expect.
- Review the stock chart last. You're looking for trend, momentum, and whether volume supports the move.
What charts can tell you without overcomplicating it
You don't need a screen full of indicators. A simple chart can already answer useful questions.
- Trend: Is the stock generally advancing, declining, or chopping sideways?
- Volume: Are big price moves backed by meaningful participation?
- Support and resistance: Has price repeatedly stalled or stabilized at similar levels?
None of this replaces fundamental work. It complements it. If you've found a quality company at a sensible valuation, technicals can help you avoid buying into obvious weakness or chasing a stretched move.
A chart won't tell you what a company is worth. It can tell you how other market participants are behaving around that stock.
The blend matters. Qualitative work helps you avoid sterile spreadsheet analysis. Technical context helps you avoid ignoring the market entirely. Together, they turn a good company review into a more complete investment decision.
From Analysis to Action Managing Your Investment
At some point, analysis has to become a decision. That decision gets cleaner when you reduce your work into a short written thesis. If you can't summarize the case in one paragraph, you probably don't understand it well enough yet.
A useful thesis includes four parts:
- Why the business is attractive
- Why the stock is priced well enough to buy
- What you expect to happen
- What would prove you wrong
That last part is where discipline starts. Investors often write down reasons to buy and skip the conditions that would invalidate the idea.

Position size should reflect uncertainty, not excitement
A stock can be your favorite idea and still deserve a modest allocation. Position sizing should account for how confident you are in the thesis, how volatile the business is, and how the stock fits with the rest of your holdings.
A few common mistakes show up here:
- Oversizing early: Initial conviction is often highest before the market has tested your thesis.
- Ignoring correlation: Two different stocks can still carry similar risks if they depend on the same industry or macro backdrop.
- Averaging down without a reason: A lower price isn't automatically a better opportunity.
If you track broader conditions as part of your process, analyzing market signals from Salesmotion offers a useful way to think about trend context around your individual positions.
Decide your exit rules before you buy
Exit criteria don't need to be mechanical, but they do need to be real. Write them down before the position is live.
Examples of sensible exit triggers include:
- The thesis breaks: Margins erode, debt burden grows, management changes direction, or the moat looks weaker than you thought.
- Valuation gets extreme: The stock price runs far ahead of the business case.
- A better opportunity appears: Capital is limited, and investing is partly a ranking exercise.
Decision test: If the stock fell tomorrow, would you know whether to buy more, hold, or sell? If not, the plan isn't finished.
Analysis earns its keep only when it shapes behavior. A written thesis, a realistic position size, and predefined exit criteria turn a pile of research into an investing process you can trust.
If you want one workspace for screening stocks, reviewing company data, and keeping your watchlist organized, Finzer is built for that kind of repeatable workflow. It fits the way individual investors work. Quick first pass, focused review, then deeper analysis only when a stock earns it.